Accounts prioritised on a weak basis
Without reliable volumes per hospital, visits, samples and offers end up at the wrong hospitals. Sales time is used up, revenue is left on the table.
Market potential from the quality reports of German hospitals
QD4Sales shows medical technology manufacturers and distributors where their hospital market is: site by site, from the public quality reports. Every quantity appears as a safe range, with its source and data release.
No form and no registration: you write to us, we get back to you personally.
Example
Hip endoprostheses (OPS 5-820), inpatient procedures, Germany, reporting year 2023
In reporting year 2023, 1,097 sites together report 267,443 to 277,799 procedures under 5-820. QD4Sales ranks them by the safe lower bound and, for comparison, shows the 266,678 implantations counted by external quality assurance, once per hospital.
Problem
Many manufacturers and distributors know their own sales, but not the market behind them. Which hospital performs how many procedures often rests on gut feeling, single conversations and old lists.
Without reliable volumes per hospital, visits, samples and offers end up at the wrong hospitals. Sales time is used up, revenue is left on the table.
The shift to outpatient care, the hospital reform and demographic change move procedures between hospitals. Without seeing what has already changed, decisions rest on outdated assumptions.
The quality reports are open to everyone, but reporting year 2023 alone comprises 2,309 reports as XML files. Small case counts are suppressed, formats and site numbers change over the years.
Solution
QD4Sales reads the quality reports of all hospital sites that publish one and turns them into an application for sales and product management. Using hips as the example:
TodayThe foundation is in place: QD4Sales works with reporting year 2023 for every hospital site that publishes a quality report. Further years, the map and further checked templates follow step by step, the roadmap shows the way.
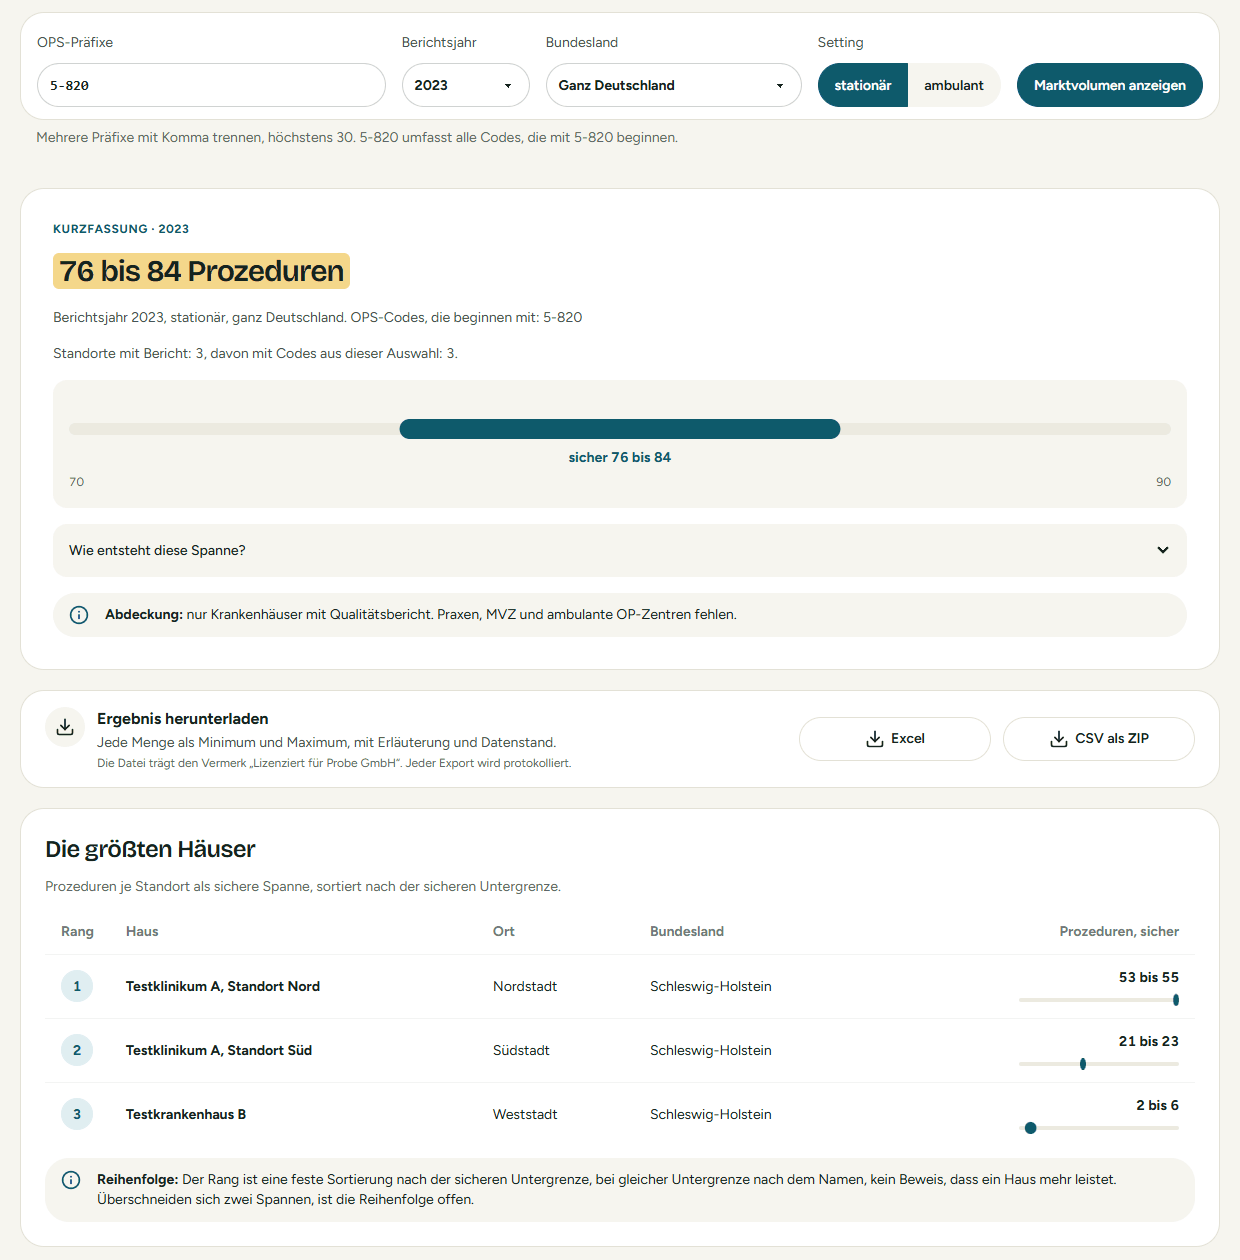
Use the checked template for hip arthroplasty or build your own segment from OPS and ICD codes, for example all codes under 5-820.
Market volume appears per reporting year as a safe range, for Germany, a federal state or the area around a location. Where quality assurance counts cases, they appear alongside.
The ranking orders hospitals by the safe lower bound. Filter by region, beds, ownership or emergency care level and see where two ranges overlap.
The hospital profile shows the master data and services of a site. The export to Excel or CSV carries unit, data release and explanation, so you can put your own sales next to it.
Case counts of 1 to 3 are suppressed in the reports for data protection reasons. This affects about two thirds of the OPS rows, but only 3 to 9 percent of the volume. QD4Sales counts each suppressed row as 1 in the lower bound and as 3 in the upper bound. The reported quantity lies safely in between. Nothing is estimated, nothing is set to zero.
Hip endoprostheses (OPS 5-820), inpatient procedures, Germany, reporting year 2023. Procedures count OPS codes, quality assurance counts cases. The safe range lies 0.3 to 4.2 percent above the implantations counted by quality assurance per hospital. Where a hospital deviates clearly, QD4Sales shows a note.
Source: Qualitätsberichte der Krankenhäuser nach § 136b Abs. 1 S. 1 Nr. 3 SGB V i. V. m. den Regelungen zum Qualitätsbericht der Krankenhäuser (Qb-R), reporting year 2023, used in extracts and with our own analysis. Full reports at www.g-ba.de/qualitaetsberichte.
How large is the market for your segment in Germany, in a federal state or in your territory? Export the ranges and put your sales next to them.
Which hospitals perform the most in your segment, and which of them are not yet your customers? With the existing customers module you mark your installed base.
Size, departments, service profile and volume in your segment: the essentials about a site, shortly before the meeting.
Benefits
The relevant figures with little effort of your own, traceable back to the source.
Difference
We show what the data supports and say openly where it ends.
Every quantity has a safe lower and upper bound. Suppressed case counts never count as zero. The ranking follows the lower bound.
For checked templates we compare every data release with the cases counted by quality assurance, hospital by hospital.
You see whether a figure is counted, calculated from OPS or derived from diagnoses, and which data release it comes from.
You work with the data yourself, without a project and without consulting hours. Every new reporting year is added at no extra effort.
After the demo we set up a trial access for you. You see the whole market, and up to three hospitals you know well with names and figures.
Servers in Germany, no third parties in the browser. Your selections and existing customers stay separate from other customers, including your competitors.
Roadmap
Three stages, each building on the previous one. Every quantity remains a range.
V1in progress
V1 shows what hospitals reported, not today's total market and not a sales opportunity.
V2planned
OPS code product category consumption factor expected demand
V2 shows modelled demand under disclosed assumptions, not actual purchasing.
V3planned
Potential = demand minus your sales
V3 shows remaining theoretical demand, not winnable revenue.
About us
Builds QD4Sales and takes care of data and calculation. [Kent's background, one or two sentences]
Brings in the domain perspective and checks whether the figures hold up in everyday sales. [Hauke's background, one or two sentences]
QD4Sales is deliberately a niche product: for a manageable number of manufacturers and distributors who want to understand their hospital market. The two of us run it and only build what two people can operate with care.
For you, that means short paths. You talk directly to the people who do the calculations and get an answer when a figure raises questions.
Contact
Tell us which market you want to understand. We will show you QD4Sales with your segment.
Or write directly to [kontakt@domain]
We create accounts personally, there is no registration. Already a customer? Sign in